1
2
3
4
5
6
7
8
9
10
11
12
13
14
15
16
17
18
19
20
21
22
23
24
25
26
27
28
29
30
31
32
33
34
35
36
37
38
39
40
41
42
43
44
45
46
47
48
49
50
51
52
53
54
55
56
57
58
59
60
61
62
63
64
65
66
67
68
69
70
71
72
73
74
75
76
77
78
79
80
81
82
83
84
85
86
87
88
89
90
91
92
93
94
95
96
97
98
99
100
101
102
103
104
105
106
107
108
109
110
111
112
113
114
115
116
117
118
119
120
121
122
123
124
125
126
127
128
129
130
131
132
133
134
135
136
137
138
139
140
141
142
143
144
145
146
147
148
149
150
151
152
153
154
155
156
157
158
159
160
161
162
163
164
165
166
167
168
169
170
171
172
173
174
175
176
177
178
179
180
181
182
183
184
185
186
187
188
189
190
191
192
193
194
195
196
197
198
199
200
201
202
203
204
205
206
207
208
209
210
211
212
213
214
215
216
217
218
219
220
221
222
223
224
225
226
227
228
229
230
231
232
233
234
235
236
237
238
239
240
241
242
243
244
245
246
247
248
249
250
251
252
253
254
255
256
257
258
259
260
|
# Dusky Neon Potato [](https://raw.githubusercontent.com/VVelox/hugo-dusky-neon-potato/master/LICENSE.md)
Outrun with the power of a potato. Based on the Potato Dark theme with CSS bits inspired by Dusk.
## Overview
* Support for tags
* Responsive design
* Support for Related Content
* Analytics with Google Analytics
* Modern, Simple and beautiful design
* Medium's Image Zoom([zoom.js](https://github.com/fat/zoom.js/))
* Social links (most social networks available)
* Inlined CSS for customizable colors via config.
* Outrun inspired foreground colors on a dark background, by default.
* Can turn off pagination.
* The ability to enable sorting of tables for pages.
* Graphing via [C3](https://c3js.org/).
* Can set a page to refresh via Front Matter.
## Usage
Use hugo's -t dusky-neon-potato or --theme=dusky-neon-potato option with hugo commands. Example:
```shell
$ hugo server -t hugo-dusky-neon-potato -w -D
```
## Shortcodes
### Image Zoom
Use short code for Image Zoom.
```
{{% zoom-img src="/images/default.jpg" %}}
```
### Graphing
To enable graphing, you first need to set 'graphing' to true in Front Matter
as below. With out that, none of the shortcodes will work properly as the required
CSS and JS will not be included in the header.
```
graphing: true
```
Currently the possible charts that can be made with out issue are as below.
* line
* spline
* bar
* scatter
* pie
* donut
* gauge
Below is a example of creating a chart.
```
{{% chart-place chart="example" %}}
{{% chart-generate url="https://foo.bar/c3_test.csv" type="line" chart="example" yLabel="Y1 label" xLabel="X label" %}}
```
Graphing is handled by [C3](https://c3js.org/) and you can find the documentation at https://c3js.org/reference.html .
#### chart-place
This short code places the HTML that the JS will bind to.
| Variable | Default | Description |
| --- | --- | --- |
| chart | chart | The name of the chart. |
#### chart-generate
This generates the chart and binds it to the HTML.
| Variable | Default | Required | Description |
| --- | --- | --- | --- |
| [chart](https://c3js.org/reference.html#bindto) | chart | no | The name of the chart. |
| [url](https://c3js.org/reference.html#data-url) | null | yes | The URL for the CSV. |
| [type](https://c3js.org/reference.html#data-type) | line | no | The type of chart it is. |
| [x](https://c3js.org/reference.html#data-x) | null | no | The column name to use for X axis info. |
| [xLabel](https://c3js.org/reference.html#axis-x-label) | null | no | The label for the X axis. |
| [yLabel](https://c3js.org/reference.html#axis-y-label) | null | no | The label for the Y axis. |
| [xType](https://c3js.org/reference.html#axis-x-type) | null | no | The type of data for the X axis. |
| [xFormat](https://c3js.org/reference.html#axis-x-tick-format) | null | no | The format for the X ticks, largely for use if xType is set to 'timeseries'. |
| [axis-rotated](https://c3js.org/reference.html#axis-rotated) | null | no | If X and Y should be reversed. |
| [grid-x-show](https://c3js.org/samples/options_gridline.html) | null | no | If the X grid should be shown. Set to 'true' to enable. |
| [grid-y-show](https://c3js.org/samples/options_gridline.html) | null | no | If the X grid should be shown. Set to 'true' to enable. |
| [legend-hide](https://c3js.org/samples/options_legend.html) | null | no | If defined, this hides the legend. |
| [zoom-enable](https://c3js.org/samples/interaction_zoom.html) | null | no | If defined, this enables zooming. |
| [zoom-rescale](https://c3js.org/reference.html#zoom-rescale) | null | no | If defined, this enables rescaling when zooming. |
| [subchart-enable](https://c3js.org/samples/options_subchart.html) | null | no | If defined, this enables shows a sub chart, which can be useful when zooming. |
| [subchart-size](https://c3js.org/reference.html#subchart-size-height) | null | no | Used for setting a custom subchart size. |
| [size-height](https://c3js.org/samples/options_size.html) | null | no | Set a specific height for the chart. |
| [size-width](https://c3js.org/samples/options_size.html) | null | no | Set a specific height for the chart. |
Please note that while C3 supports area and gauge, this currently lacks support for those.
#### chart-complex-start / chart-complex-stop
As to how to start using this, it is highly started reading https://c3js.org/gettingstarted.html .
| Variable | Default | Required | Description |
| --- | --- | --- | --- |
| chart | chart | no | The name of the chart to bind to. |
```
{{% chart-complex-start chart="foo" %}}
data: {
columns: [
['data1', 30, 200, 100, 400, 150, 250],
['data2', 50, 20, 10, 40, 15, 25]
]
}"
{{% chart-complex-stop %}}
```
is the equivalent of this...
```
var chart = c3.generate({
bindto: '#foo',
data: {
columns: [
['data1', 30, 200, 100, 400, 150, 250],
['data2', 50, 20, 10, 40, 15, 25]
]
}
});
```
## Configuration
### Disable Pagination
So lets say you have a page you don't want pagination displayed, such as "About.org",
then you can set <code>no_pagination</code> to true in the Front Matter and it won't
display.
```
---
title: "About"
date: 2018-09-02T22:41:40-05:00
draft: false
no_pagination: true
---
A rutting about page.
```
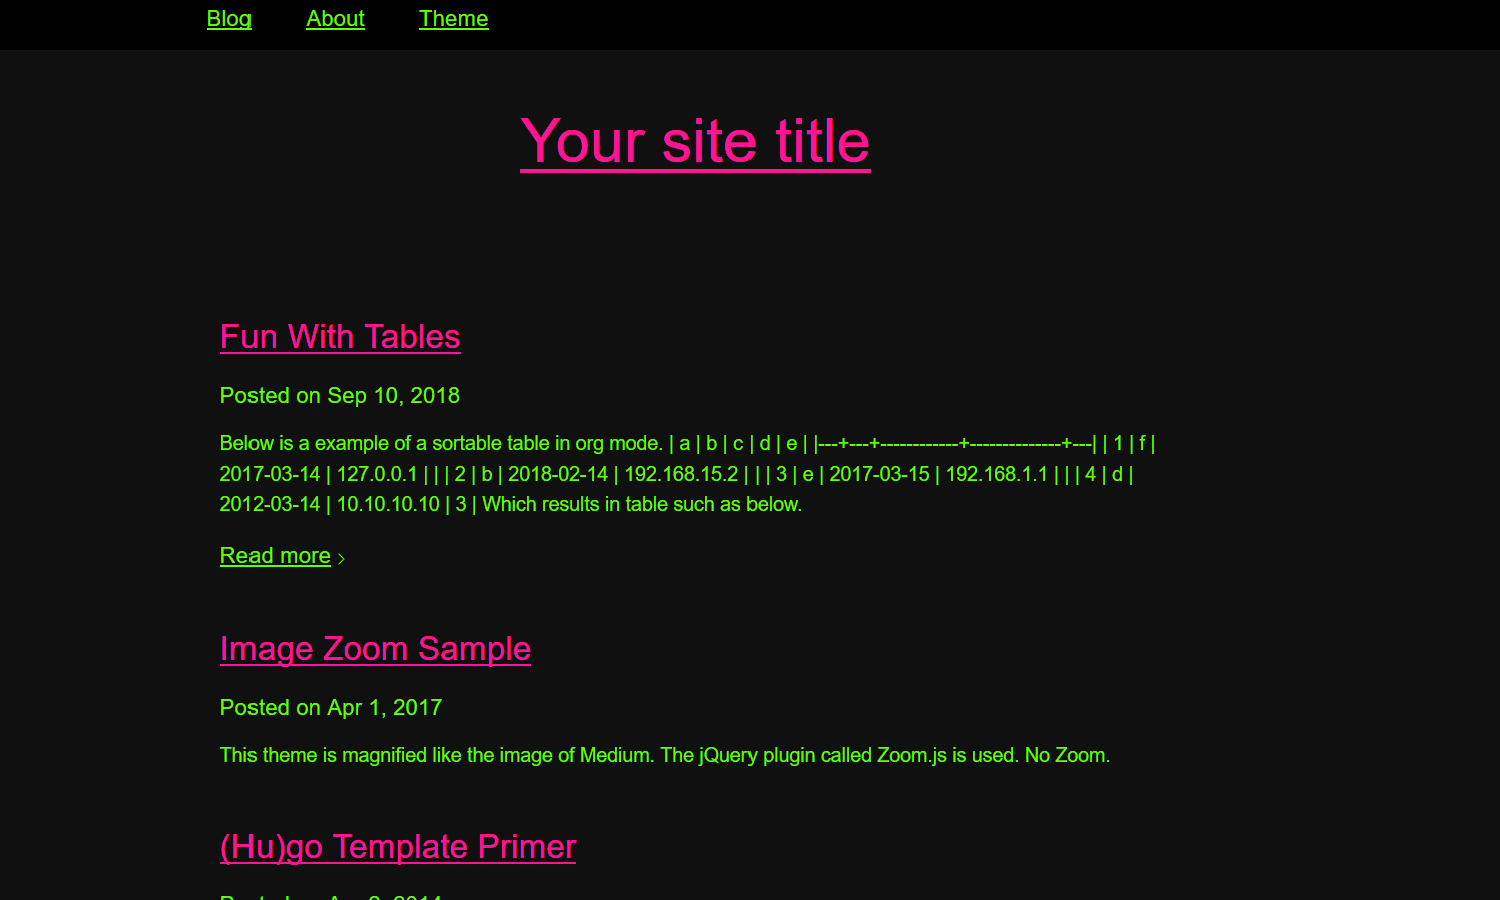
### Sortable Tables
So lets say you want to make the tables on a page sortable, you can now do this.
You can do this, by setting the Front Matter value "sort_tables" to true and in
the header it will include a link to a JS script in the js dir that does this.
Below is a org mode example with sortable tables.
```
---
title: "Tables"
date: 2018-09-02T22:41:40-05:00
draft: false
sort_tables: true
---
| a | b | c | d | e |
|---+---+------------+--------------+---|
| 1 | f | 2017-03-14 | 127.0.0.1 | |
| 2 | b | 2018-02-14 | 192.168.15.2 | |
| 3 | e | 2017-03-15 | 192.168.1.1 | |
| 4 | d | 2012-03-14 | 10.10.10.10 | 3 |
```
### Colors & Decorations
All colors/decorations stuff go under the 'colors' config section. The
defaults are shown below.
```
[colors]
#general text and background
text="#66FF00"
background="#101010"
# titles
main="#FF1493"
# headers
h1="#FF00FF"
h1-decoration="none"
h2="#DA70D6"
h2-decoration="none"
h3="#EE82EE"
h3-decoration="none"
h4="#8B008B"
h4-decoration="none"
h5="#9932CC"
h5-decoration="none"
h6="#800080"
h6-decoration="none"
# tables
table-border="#008B8B"
th-bg="#3B0072"
th-fg="#FF040C"
# content tags
ctag="#FF00FF"
ctag-hover-fg="#66FF00"
ctag-hover-bg="#101010"
# color of the tags title on that tags page
p-tag-title="#FF1493"
# related items(at the bottom of posts)
related-bg="#101010"
related-fg="#66FF00"
# graph axis
graph-lines="#66FF00"
# text on the graphs
graph-text="#FF00FF"
```
### Page Auto-Refresh
Pages can be told to auto refresh via setting the Front Matter variable 'page_refresh'. This is
number of seconds between page refreshes.
The use case for this would be if you are using graphing and have data that updates periodically
want to update the page every 5 minutes or so to pull in the changes.
```
---
title: "Auto-Refreshing"
date: 2018-09-02T22:41:40-05:00
draft: false
page_refresh: 300
---
This page will refresh every 5 minutes.
```
## TODO
* Implement more settings for gauge graph type.
* Add more axis options.
* Make the nearly invisible black triangles the show up on the graph in some modes disappear.
|
